Contents
A dimensional variation analysis model is a simulation of an assembly to predict the amount of variation resulting from piece-part tolerances and process sequence. In addition, a variation analysis simulation helps to determine the key contributors to that variation. 3DCS is a dimensional analysis tool for performing variation analysis simulations. It works by replicating the build process with deviated parts in a virtual environment. The deviations come from tolerances randomly varied within specified ranges and distributions. 3DCS simulates building thousands of assemblies to generate a statistical output for each measurement. The software analyzes every tolerance's contribution to variation. The simulation results provide critical insight to identify strengths and weaknesses of a design. This insight is essential for revisions that drive improvement in your results with greater consistency.
The purpose of a tolerance analysis model is to understand how part and assembly tolerances affect the overall build and fit of a final product. There are three main types of results that can be obtained directly from a tolerance analysis model in 3DCS: a Monte Carlo simulation, a "High-Low-Median" sensitivity analysis, and a GeoFactor geometric effects analysis. All three analyses provide different information for assessing product quality. The Monte Carlo simulation (an industry standard) predicts what percentage of builds will fail to meet critical quality characteristics. The High-Low-Median analysis, or HLM, and GeoFactor analysis both identify which tolerances are contributing the most to those failures. HLM analyzes the contribution based on the total range of a tolerance. GeoFactor analyzes the contribution based on part geometry. A combination of these three results provides the necessary information for tolerance, design, and process optimization. These optimizations can lead to reductions in assembly time, re-work, material waste, and costly rework of tooling.
A Monte Carlo Simulation will tell if the results of a measurement are "good" or "bad." It works by simulating thousands of builds using virtual parts and collecting data for each build. The simulation randomly varies tolerances within specified ranges to all parts, assembles the parts as defined in the build sequence, and then takes measurements for desired outputs. This sequence is repeated a specified number of times to populate a statistical distribution. The simulation output is presented as a histogram and statistical data for each defined measurement. The histogram plots the frequency that a measurement value should fall within a certain interval. The width of the histogram represents the range of variation of that measurement over all of the simulated builds. The user-defined specification limits signify the acceptable manufacturing range. From the simulation results, the mean, standard deviation, distribution, and other statistics can be determined per measurement.
A "High-Low-Median", or HLM, Sensitivity Analysis provides information to make improvements to the model. HLM Sensitivity determines which tolerances have the largest contribution per measurement. It works by varying an individual tolerance to a High, Low, and Median position, while holding the rest of the tolerances within a model at their nominal values. This process is repeated for all toleranced features. When a specific tolerance is varied and results in a larger value for a given measurement, the measurement is considered to be more sensitive to that particular tolerance. Each contributor percentage is calculated based on corresponding measurement values at High, Low, Median, and Nominal. HLM Sensitivity lists the contributors to variation in descending order. Changing a tolerance at the top of the list will have a greater impact on the measurement than changing a tolerance at the bottom of the list. Be aware that while a tolerance may have a small contribution to one measurement, its contribution to other measurements may be large.
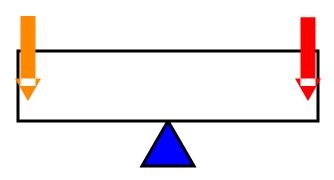
Similar to the High-Low-Median sensitivity analysis, GeoFactor examines the effect of each tolerance on a given measurement. Unlike HLM sensitivity, which analyzes the range of a tolerance, GeoFactor analysis examines the contribution of the tolerance based on geometry effect. To represent this effect, the result is given as a G Factor. The G Factor is the geometric multiplier of each tolerance in a measurement. If a tolerance has a G Factor < 1, it will mitigate the tolerance's contribution to the variation in the measurement. If the G Factor is > 1, it will amplify the tolerance's contribution to the variation in the measurement. Picture a lever where one side is controlled and the other side is measured. If the fulcrum is centered, the G Factor will be 1 because the measured side will vary with the same range as the controlled side. As the fulcrum moves nearer to the controlled side, the measured side will vary more than the controlled side. Thus, the G Factor will increase. As the fulcrum moves further from the controlled side, the measured side will vary less than the controlled side. Thus, the G Factor will decrease. GeoFactor can help you decide whether changing locators or geometry would be advantageous to improving design. Ideally, a model will have the smallest G Factors possible to mitigate variation.
3DCS Variation Analyst has the ability to generate a report containing the outputs and inputs of your model. This report can be created in html or excel format with fast and effective collaboration with colleagues, customers and management. With easy to edit areas and automated formatting, you can share your results without spending days cutting and pasting screen shots and creating tables.
A 3DCS Variation Analysis model requires four basic input elements: Part Geometry, Assembly Sequence, Tolerances, and Measurements. Part Geometry defines the different features that will be analyzed in the model. If the CAD geometry does not exist yet, points can be used to represent part features. The Assembly Sequence defines how the parts locate to one another and their order in the assembly. Within 3DCS, a "move" defines how one part locates to another. Moves must be added to the model to represent each of these steps in the build process. No part can be manufactured exactly as it was designed in nominal CAD. Variation in a part's geometry can affect the quality and function of the assembly. Tolerances define the variation from nominal geometry within specified limits. Through moves, the tolerances of individual parts stack up and lead to variation in the overall assembly. Measurements then track this assembly variation. Measurements quantify the range of variation of the desired output - for instance, gap, flush or clearance between parts. Even if some of the input information is not available, the model can still be created. Preliminary inputs are assumed and their values can be updated later. This can be advantageous if the model is created early in the design process as there will be the greatest freedom to make changes to improve the design.
The first requirement of a 3DCS Variation Analysis model is the nominal part geometry. This can include parts and assemblies from most CAD programs including CATIA, SolidWorks, and NX. The top level assembly is imported into the 3DCS software and is ready for analysis. If the nominal geometry does not exist yet or is incomplete, points can be used to represent features in place of the CAD geometry. This is common to represent tooling in an assembly. Points can also be used to test design changes before the effort is made to update the CAD data. This is an advantage to optimize the design before the geometry is finalized. Old parts can be swapped out for new parts as the design is updated without losing any information already created in the model.
The Assembly Sequence determines how parts locate to one another and in what order. In 3DCS, a "move" defines how a part is located in space. Moves are added to the model to represent each step in the build process. A move reflects how the variation of the locating features is transmitted through to a product. In the nominal CAD, parts are in their correct positions but without a defined relationship to one another or information about the order in which they were assembled. Moves establish this relationship and order. Most moves represent the attachment of one part to another. The features that attach parts are also known as locators. Ideally, the GD&T datum features will be the locators for the move. This way, the locators will be theoretically perfect and drive the variation to non-critical areas of the part. Both CAD features and points in space can be used as locators. Because of these points, CAD geometry is not necessary for model but useful for visualization purposes.
While CAD geometry is designed to be perfect, a certain amount of variation is inherent in any manufacturing process. In 3DCS, tolerances add that variation to the nominal CAD geometry. As individual parts are assembled, tolerances stack up and can lead to even greater variation in the overall assembly. Hence, tolerances play a vital role in the manufacturing of any product. The tolerances used in the 3DCS model can come from actual measured parts, from detail tolerances allowed on the prints, or from "what-if" scenarios. Manufactured part dimensions will not always be at the maximum or minimum values specified in detail prints. 3DCS allows the user to set the range, offset, distribution, and other parameters of the tolerance to simulate the manufacturing process as closely as possible. The exact value of the dimension is randomly generated during the simulation by a Monte Carlo random number generator according to these parameters. There are two main categories of tolerances: DCS Tolerances and DCS GD&T. DCS Tolerances are used for applying variation directly to points or features. DCS GD&T adds variation according to GD&T callouts in the model.
Measurements quantify the variation of the desired output in the model. They aid in understanding the effects of 3D tolerance stack ups. Measurements are used to determine how critical dimensions in an assembly are affected by fixture and part tolerances. Both points on a surface or the feature itself can be used to define a measurement. Acceptable ranges for a measurement can be set to quickly identify dimensions that are outside of specified limits. When run through a Monte Carlo simulation, the output of a measurement is a summary of statistics including the mean, standard deviation, and many more customizable settings.

2805 Bellingham
Troy, Michigan, USA 48083
Call us: +1-248-269-9777